
How is a data story created on Tableau?
Stories in Tableau are a sequence of visualisations that work together to convey information. A story is a sheet, so methods you use to create a name and manage worksheets and dashboards also apply to stories.
A story can also be a collection of sheets, arranged in a particular sequence. Once you share a story on Tableau, users can interact with the story to reveal new findings or ask new questions on the data.
To see an example how to build a story in Tableau read the following article: Example – A Story That Examines a Trend [1]
You may also wish to log in to the Tableau website and complete the Story Points tutorial.
How to create a story on Tableau
Step 1 Click the ‘New Story’ tab:

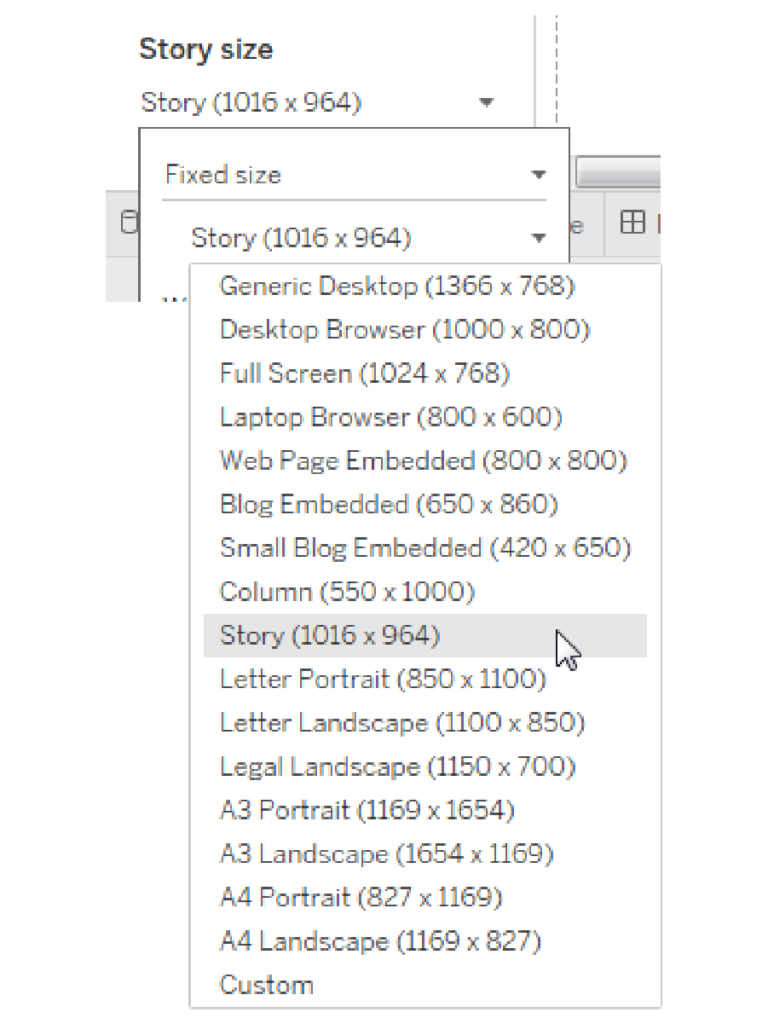
Step 2 In the lower-left corner of the screen, choose a size for your story. Choose from one of the predefined sizes, or set a custom size (in pixels):
Step 3 By default, your story takes its title from the sheet name. To edit it, right-click the sheet tab, and choose ‘Rename Sheet’.
Step 4 To start building your story, double-click on a sheet on the left to create a new story point (i.e. an individual sheet):
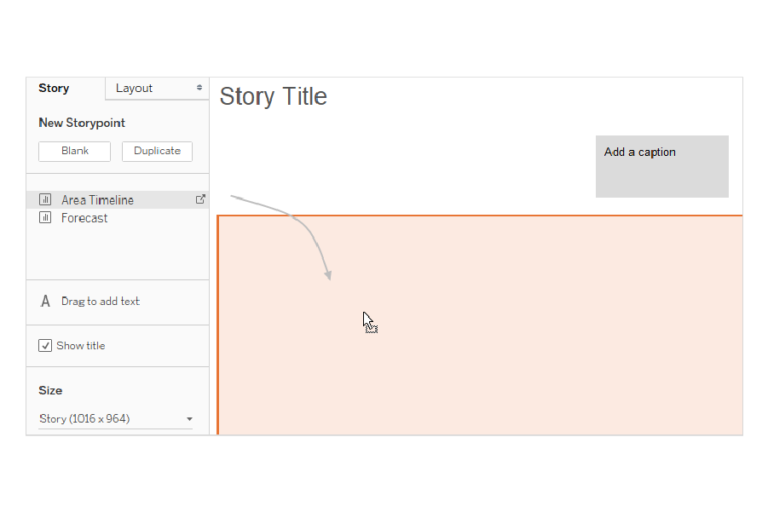
Step 5 To summarise the story point, you can click ‘Add’ to add a caption. In Tableau Desktop, you can highlight a key takeaway for your viewers by dragging a text object to the story worksheet and typing a comment.
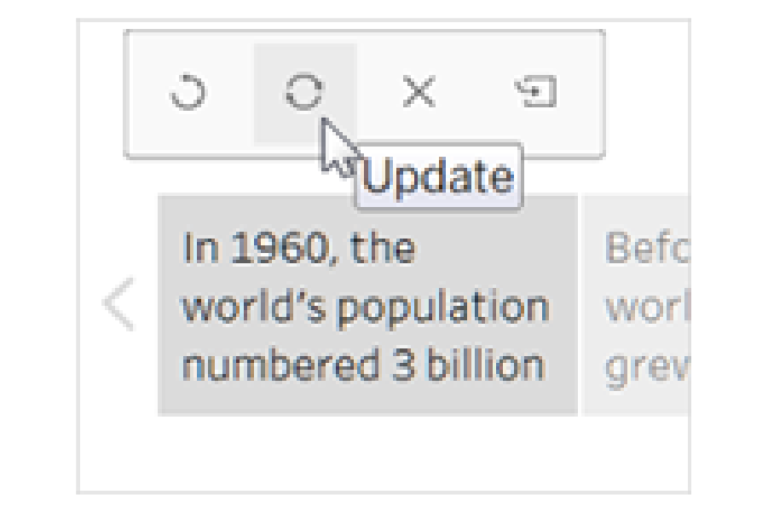
Step 6 To further highlight the main idea of this story point, you can change a filter or sort on a field in the view. Then, save your changes by clicking ‘Update’ on the story toolbar above the navigator box:
Step 7 Add another story point by doing any of the following:
- Click ‘Blank’ to use a fresh sheet for the next story point. Start customising a story point and click ‘Save as New’ on the toolbar above the navigator box:
- You can also click ‘Duplicate’ to use the current story point as the basis for a new one:
References
- Example – A Story That Examines a Trend [Internet]. Tableau; 2020. Available from https://help.tableau.com/current/pro/desktop/en-us/story_example.htm
- Story Points. Tableau; [date unknown]. Available from: https://www.tableau.com/learn/tutorials/on-demand/story-points?playlist=438454
Financial Analysis for Business Performance: Reporting and Stakeholder Management


Financial Analysis for Business Performance: Reporting and Stakeholder Management
Reach your personal and professional goals
Unlock access to hundreds of expert online courses and degrees from top universities and educators to gain accredited qualifications and professional CV-building certificates.
Join over 18 million learners to launch, switch or build upon your career, all at your own pace, across a wide range of topic areas.


