
Exercise: monitoring land cover change in Kenya
of Kenya between 1995, 2005, and 2015 using CATE.
You have just reflected on the analyses of soil moisture data to identify and quantify droughts in Kenya. In this exercise, you will investigate the changes in the land cover of Kenya between 1995, 2005, and 2015. In this exercise, you will be using CATE, (Software as a Service, CATE SaaS). For more information on how to use this cloud-based version of CATE you are encouraged to review the exercise on CATE SaaS
Exercise’s objective
As droughts in Kenya appear to be becoming more frequent and more severe over time, the land cover is becoming progressively more arid. As a result, crop failures and livestock deaths lead to severe food shortages in Kenya. To mitigate the effects of climate change on food shortage in Kenya, aid programmes like The International Maize and Wheat Improvement Center are heading towards introducing drought-tolerant crops, changing the land cover (see Figure 1).
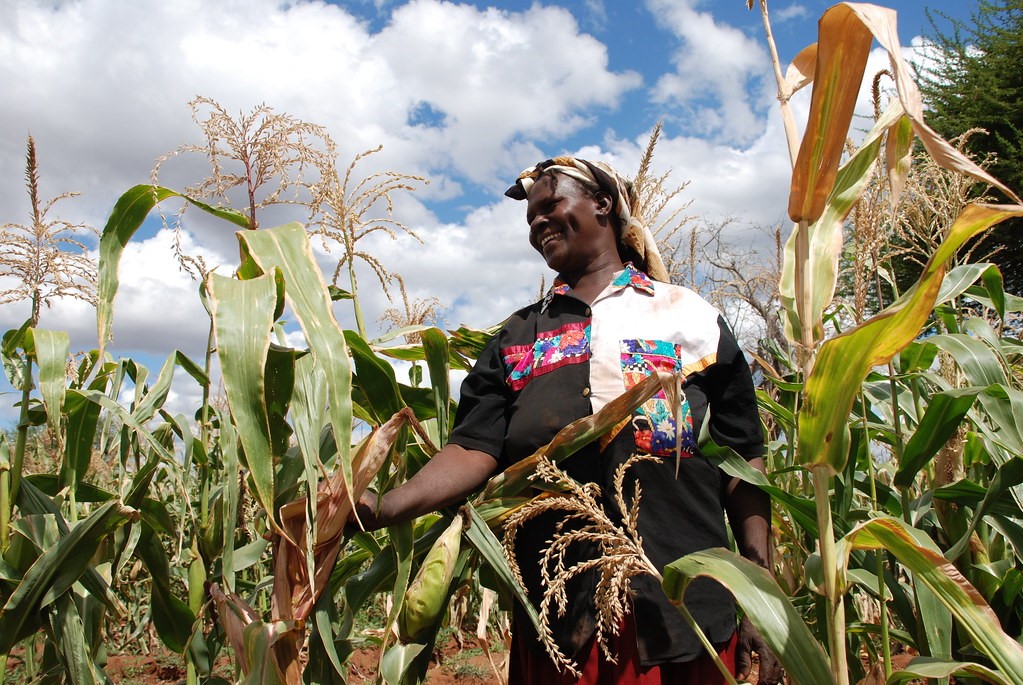
Figure 1: Drought tolerant maize route out of poverty for community-based seed producer, Kenya, by CIMMYT, licensed under CC BY-NC-SA 2.0. (Click to expand)
Exercise’s tasks
1 – At the first step, make sure that you have access to the CATE Cloud Service.
2 – Check out the Open Data Portal where you can find information about the available Land Cover products.
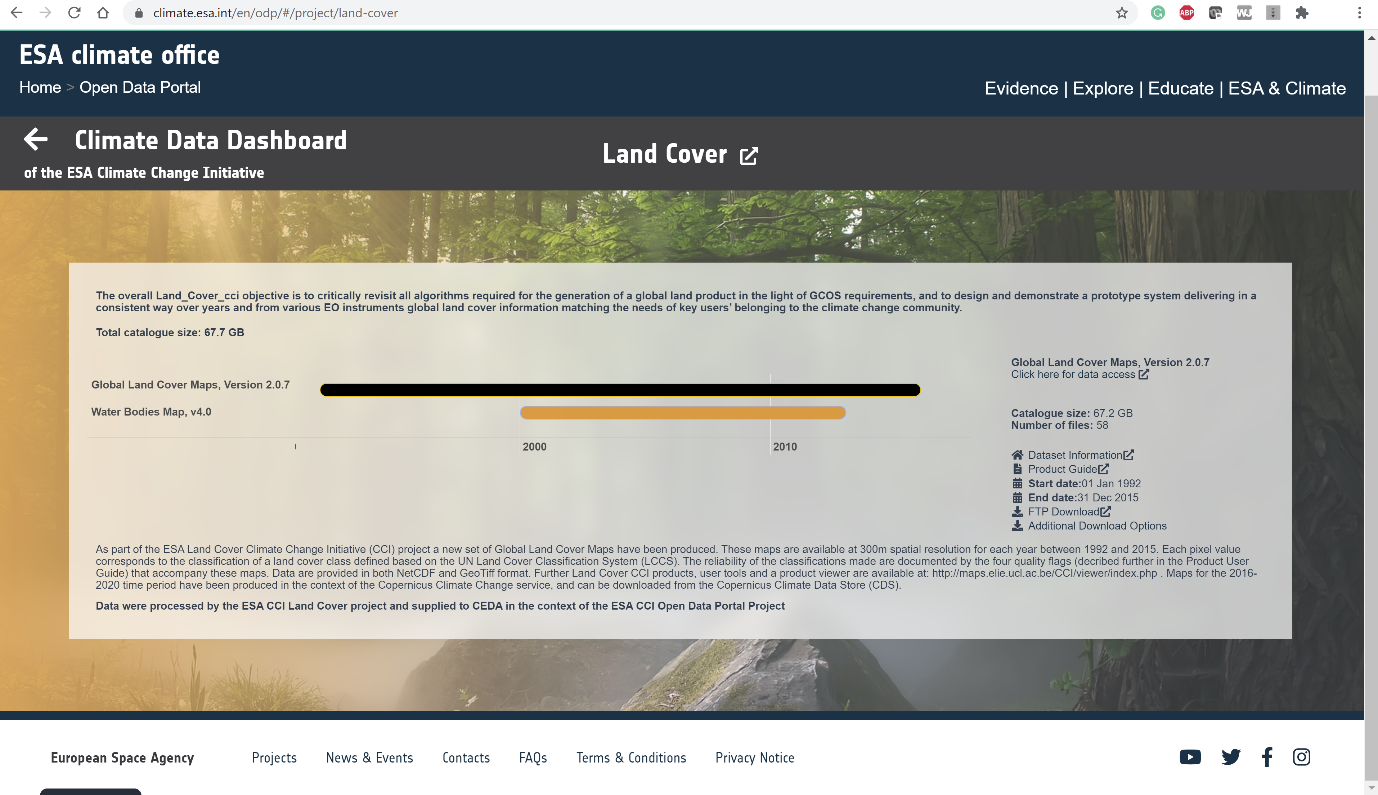
Figure 2: Land Cover Data in the Climate Office Website
3 – You can also use CATE to find Land Cover Data. There are two Land Cover data sets available in the CCI Open Data Portal data store: One at a temporal resolution of 13 years, the other at a 1-year resolution. The latter is also included in the CCI Zarr Data Store, so for this exercise, we are going to use that one.
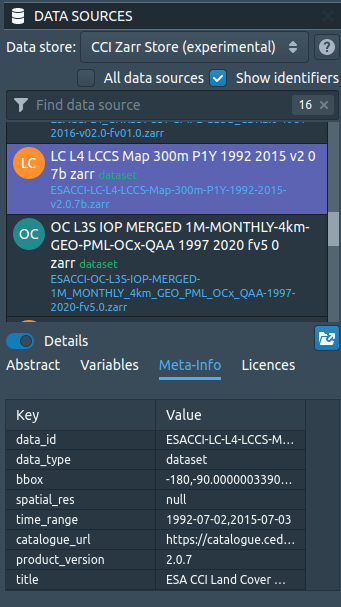
Figure 3: Land Cover Data in the CCI Zarr Store
As the data set covers the time range we are interested in, there is no need to select a temporal subset. If you want to apply a spatial subset, make sure you include Kenya. The bounding box is longitude [33, 42], latitude [-5, 5] (Figure 4).
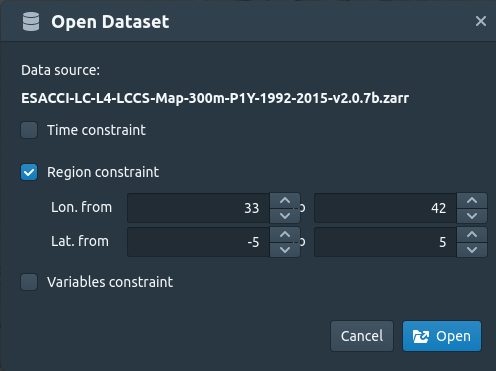
Figure 4: Opening the Land Cover Map with a bounding box fit to Kenya.
4 – The Land Cover Class is given as an index. The meanings of the indexes are explained here. As you can see, there is a dedicated colour bar that has been preconfigured for Land Cover data and that is already applied in CATE. You can change the colour bar if you activate the STYLES panel in the lower right and then click the colour bar (Figure 5). However, we recommend you stick to the dedicated Land Cover scheme.
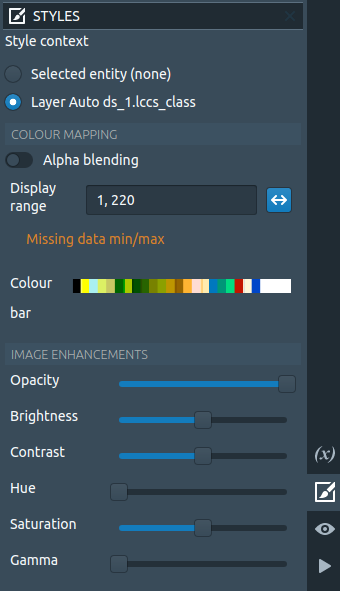
Figure 5: CATE’s STYLES panel
At the top right, you can switch to the LAYERS panel by selecting the Layers symbol. If you do so, you will see that there is a time slider that will allow you to select different time steps (Figure 6). The time of the selected step is always displayed at the top of the world view.
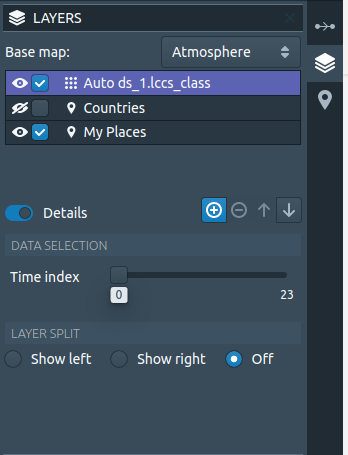
Figure 6: CATE’s LAYERS panel
Also, you may open a second world view, which you might find convenient to compare maps: Simply click New World View from CATE’s VIEW panel, located at the lower right.
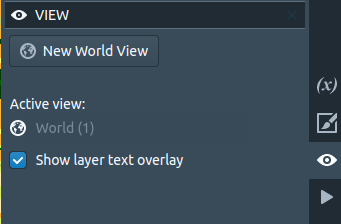
Figure 7: CATE’s view panel
If you have opened more than one view, you can split these horizontally or vertically using the icons in the top right corner (Figure 8).
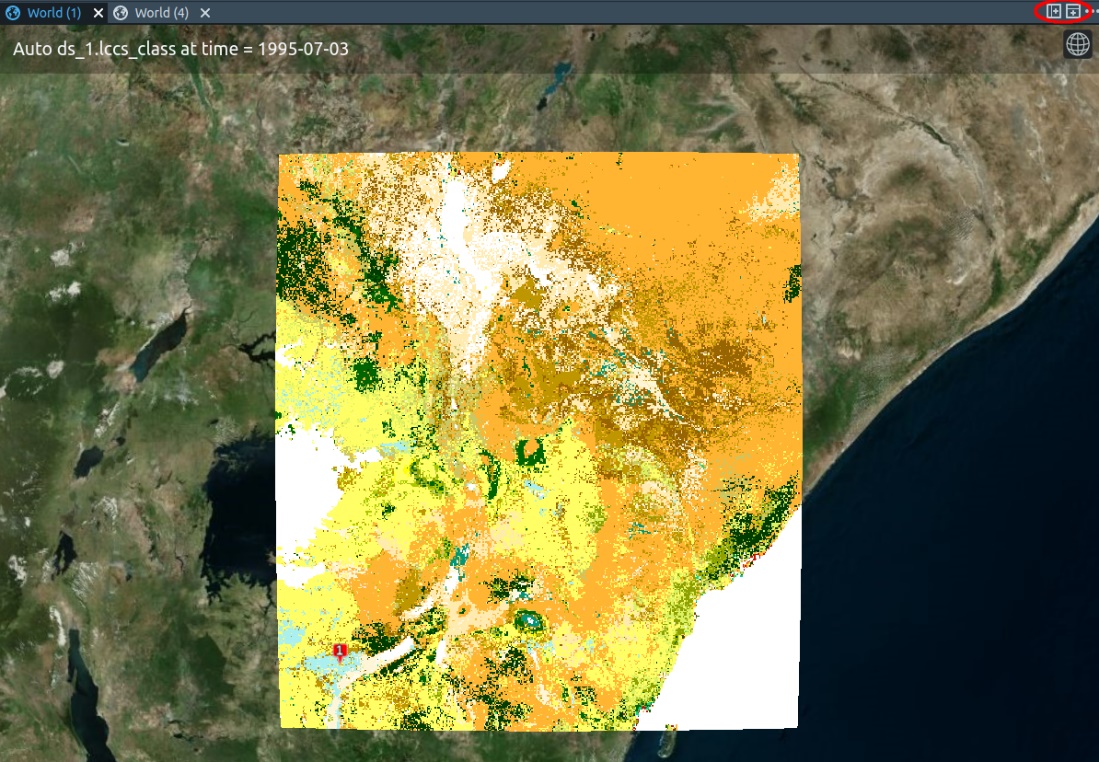
Figure 8: A world view sharing a panel with another world view. The icons to separate views are marked with a red circle.
5 – Compare the Land Cover maps of Kenya for the years 1995, 2005 and 2015 (Figures 7, 8, and 9, respectively). Pay particular attention to cropland. Values 10, 11, and 12 (in yellow) stand for rainfed cropland; value 20 for irrigated or post-flooding cropland.
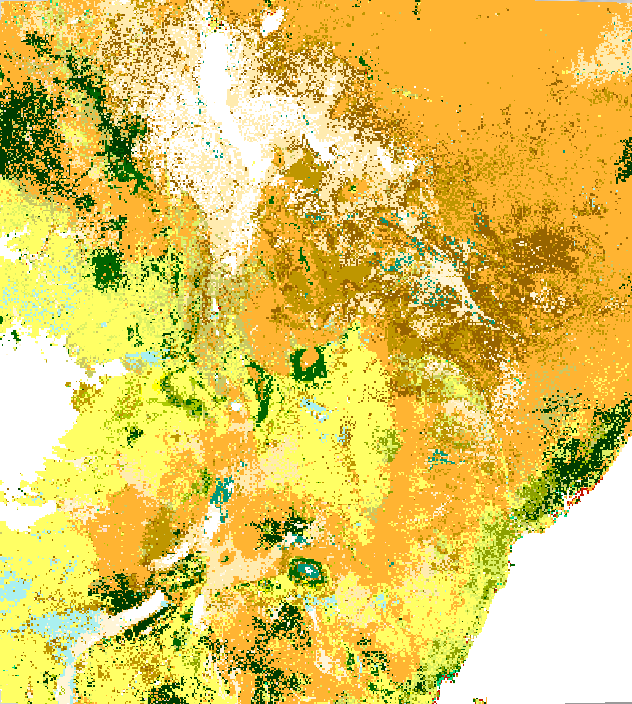
Figure 7: Kenya Land Cover Map, 1995 (Click to expand)
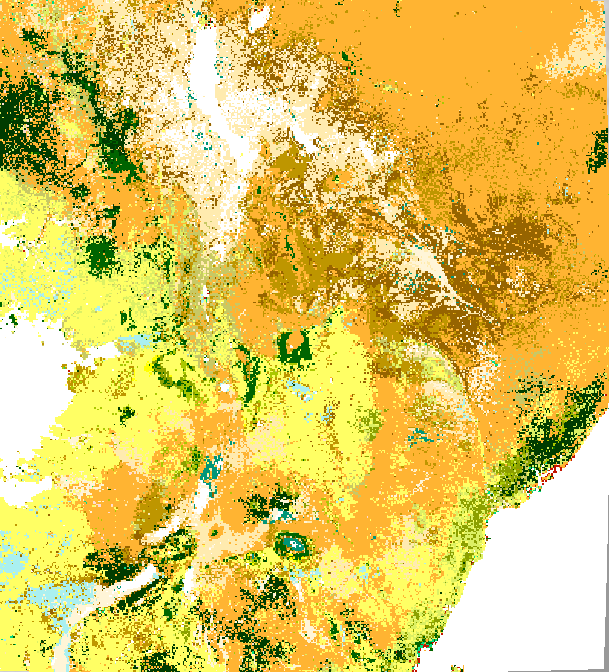
Figure 8: Kenya Land Cover Map, 2005 (Click to expand)
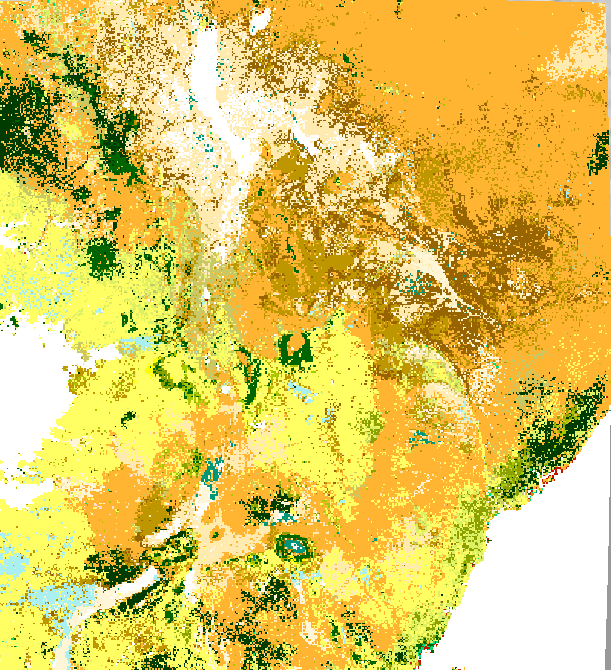
Figure 9: Kenya Land Cover Map, 2015 (Click to expand)
Up next
Once you have done the exercise, it is time to discuss what you can learn from the data.
Understanding Climate Change using Satellite Data


Understanding Climate Change using Satellite Data
Reach your personal and professional goals
Unlock access to hundreds of expert online courses and degrees from top universities and educators to gain accredited qualifications and professional CV-building certificates.
Join over 18 million learners to launch, switch or build upon your career, all at your own pace, across a wide range of topic areas.


