Skip main navigation

New offer! Get 30% off one whole year of Unlimited learning. Subscribe for just £249.99 £174.99. New subscribers only. T&Cs apply

Find out more

Explanatory or exploratory

learn what is explanatory or exploratory

When to use what?

This does not necessarily have a black and white answer. As with so much data around us, from so many sources (we covered this in part one), and so many ways to analyse those data, the answer is ‘It depends’.

However, it’s worth understanding the difference between the two.

Let’s look at the comparison table to have a better understanding of their application.

Comparing explanatory and exploratory visualisation

Explanatory Exploratory
Data explanation Data exploration
Meant for non-expert audience, having no background knowledge of the subject matter Meant for expert user group, having prior knowledge in the subject matter
Represents understandable visual data Represents complexities of big data
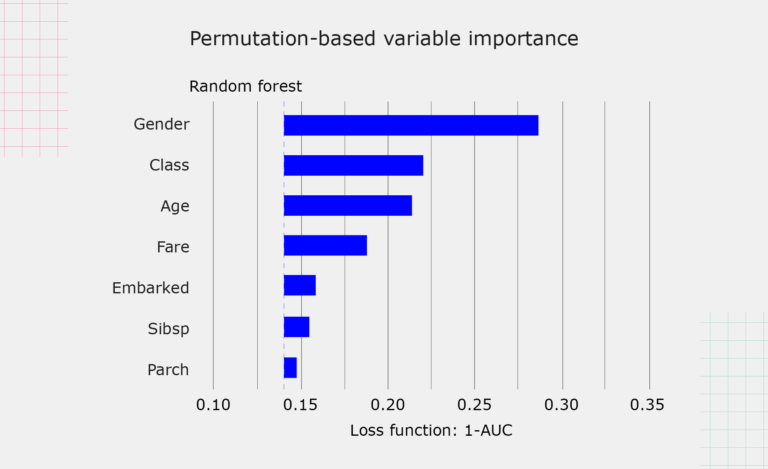
Doesn’t have analytical purposes Graphic shows a horizontal bar chart. Heading: Permutation-based variable importance. Y-axis from bottom to the top reads: Parch, Sibsp, Embarked, Fare, Age, Class, Gender. X axis “Loss function: 1-AUC” from left to right reads: 0.10, 0.15, 0.20, 0.25, 0.30, 0.35. There's a vertical dashed line at around 0.14 of the X axis. This is the starting point of all the horizontal bars. Gender bar goes all the way to the right at about 0.28. Class bar goes all the way to the right at about 0.22. Age bar goes all the way to the right at about 0.21. Fare bar goes all the way to the right at about 0.18. Embarked bar goes all the way to the right at about 0.17. Sibsp bar goes all the way to the right at about 0.16. Parch bar goes all the way to the right at about 0.15. Click to enlarge Has analytical purposes Graphic shows a horizontal bar chart. Heading: Permutation-based variable importance. Y-axis from bottom to the top reads: Parch, Sibsp, Embarked, Fare, Age, Class, Gender. X axis “Loss function: 1-AUC” from left to right reads: 0.10, 0.15, 0.20, 0.25, 0.30, 0.35. There's a vertical dashed line at around 0.14 of the X axis. This is the starting point of all the horizontal bars. Gender bar goes all the way to the right at about 0.28. Class bar goes all the way to the right at about 0.22. Age bar goes all the way to the right at about 0.21. Fare bar goes all the way to the right at about 0.18. Embarked bar goes all the way to the right at about 0.17. Sibsp bar goes all the way to the right at about 0.16. Parch bar goes all the way to the right at about 0.15. Click to enlarge

So far you must have understood the basic difference between explanatory and exploratory visualisation. Nonetheless, the bigger question is: How do I identify which one to use for different kinds of data visualisation?

Here are some questions to ask when making these decisions.

Who is your intended audience?

Suppose you were contacted by a scientist who is currently working closely with the COVID-19 task team. She wants to present the data to two kinds of audiences: the media and her higher management in the hospital.

As a data analyst, exploratory visualisation should be your default choice for presenting data to the doctors and hospital leadership as they would want to understand the entire process of exploration of turning all the stones at her disposal.

For the media, on the other hand, you would simply design an explanatory visualisation. Here you need to just provide the details of what you found after turning the stones, which can be as little as just one stone.

What is the intended conclusion?

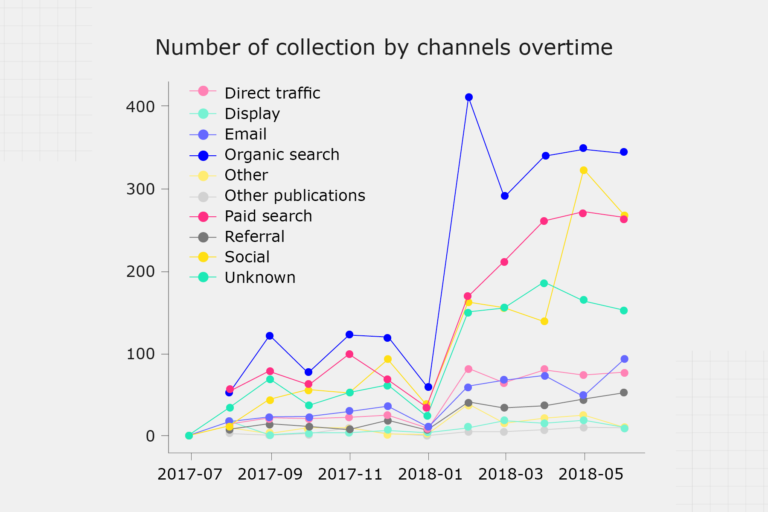
Previously, we saw an example of a comparison and conclusion we wanted the reader to make in the internet speeds (IPS charts). If there is no conclusion that we want the reader to make (such as ‘which IPS is the best?’), and instead want them to be able to explore and find data that’s relevant to them (such as ‘how much data will they use monthly?’), we should present it as an exploratory visualisation.

For example:

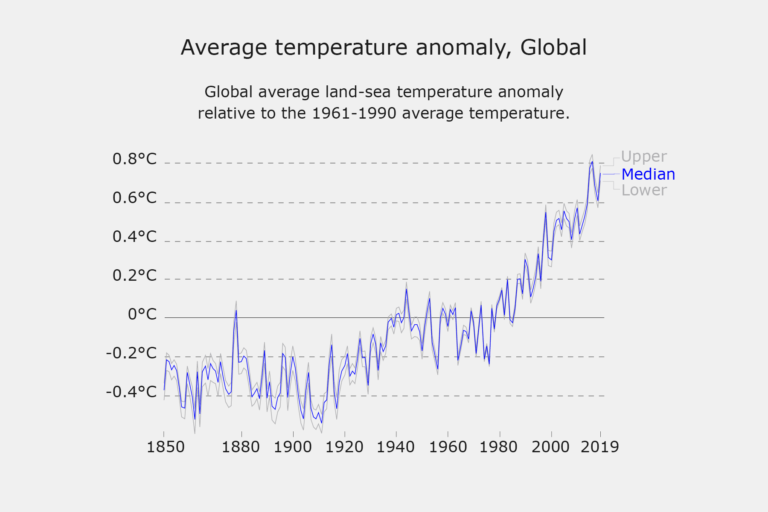
This is the Global Change Data Lab’s Our World in Data web site on CO2 and Other Greenhouse Gas Emissions.

Graphic shows a complex global average temperature anomaly chart. The y-axis from bottom to top reads: -0.4°C, -0.2°C, 0°C, 0.2°C, 0.4°C, 0.6°C, 0.8°C. The x-axis from left to right reads: 1850, 1880, 1900, 1920, 1940, 1960, 1980, 2000, 2019. There are three very busy zigzag lines that spread across the chart. Line 1 is labelled as "Lower". Line 2 which is colored blue is labelled at "Median". Line 3 is labelled as Upper. The busy zigzag lines go upward starting at -0.4°C on the y-axis all the way up to 0.8°C on the y-axis.

The data suggests a severe increase in the gas emission from 1850 to 2019. The primary suspected reason is climate change and global warming. This does not present a narrative but is intended for the layperson to be able to perform their own comparisons and visualise the data.

What is the time budget?

Suppose you are asked to present data within certain time or budget constraints; it might end up limiting the way you build your visualisation. If that would be the case, you could consider plotting the data on some charts in Excel and directly publish the charts without an explanation. This could be considered an exploratory visualisation, as we’re showing the data to the reader and allowing them to draw their own conclusion.

The next layer of complexity would be drawing those conclusions and highlighting relevant parts of the data or relationships for the reader. This would be in the explanatory data territory.

To get even more complex, we need to design and code a visualisation dashboard, allowing users to drill down into the data and interact with it in real-time. This takes a lot more time and allows us to present the data in an exploratory visualisation.

In the end, it comes down to the audience, message, and budget, for you to decide if you want to go with an explanatory or exploratory visualisation. Hence, it depends.

Reflect and share

What are your thoughts about the two types of data? Which one do you think is most useful in your professional work?

This article is from the free online

Data Visualisation with Python: Matplotlib and Visual Analysis

Created by
FutureLearn - Learning For Life

Reach your personal and professional goals

Unlock access to hundreds of expert online courses and degrees from top universities and educators to gain accredited qualifications and professional CV-building certificates.

Join over 18 million learners to launch, switch or build upon your career, all at your own pace, across a wide range of topic areas.

Start Learning now