
Data Visualisation Packages and Principles – a Focus on ggplot2
As we saw, much of what is done with R can also be done in RStudio.
Data Visualization in RStudio
Introduction
As we saw, many things you do with R can also be done in RStudio. We would advise you to take some time to test in RStudio a few commands we used previously in R, and put in a Script what you want to use later. We would also recommend that you take some time to get familiarized with the RStudio display and test the options you can use through the user interface. This will be useful for the upcoming steps, where we will need to install packages, load them, use them, and generate plots using ggplot2.
Data visualization packages in R/RStudio
For the rest of the Steps, we will see how to use a dedicated package in RStudio for data visualization, called ggplot2.
Many packages exist that are devoted to data visualization.
The base graphics comes for example with the graphics package, and allows you to generate simple plots and then to improve aspects of the plot possibly through series of functions (we saw a quick example with “par()” and “plot()”).
The lattice plotting system is implemented with other packages such as the lattice package, which supports generating trellis graphs. It is generally used with a single function call that would specify all graphical parameters, which allow R to automatically compute the necessary graphical display.
With the ggplot2 package, we are almost combining both concepts. This package is based on using the grammar of graphics concept. It became so popular, that many other data visualization packages can complement it or use it, or are based on the same concepts. Examples of other packages are ggforce or ggvis.
It is also possible now to create more advanced interactive graphs in R/RStudio using packages such as Plotly or Shiny.
The grammar of graphics: basics of ggplot2
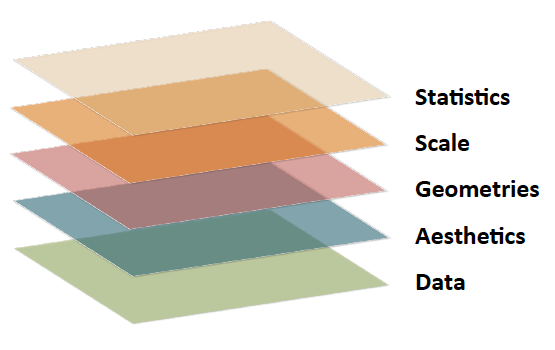
The grammar of graphics is the concept of using a particular grammar or language to specify and create certain statistical and graphical displays for data visualization. Applied to ggplot2, the grammar of graphics is implemented in a layered approach, using layers of information (data complemented with statistical or graphical information) to build up step by step to a final display of a graph. Layers complement each other in ggplot2 with different information types such as the aesthetics, the geometries, the faceting, the scales, the themes, the coordinates, the labels, and many others.
Here are explanations of some of these layers :
| DATA | The data you want to plot |
| AESTHETICS | The graphical properties of data on the plot (x, y, …) |
| GEOMETRIES | The graphical elements that determines the visual display of a plot (point, line, bar, area, …). Each geometric object is related to specific aesthetics. For example, a geometric object “point” is related to aesthetics shape, size, color and position |
| FACETING | reorganizes the variables of a data into subsets with a certain graphical arrangement of elements |
| SCALES | defines how data is mapped as related to aesthetics (item colors according to their class, …) |
| THEMES | customizes non-data related display by defining options not directly related to the data itself |
| COORDINATES | customizes the coordinates |
| LABELS | sets plot title, legend or axis names |
Let’s explore these layers of information through examples in the next Step.
Bioinformatics for Biologists: An Introduction to Linux, Bash Scripting, and R

Bioinformatics for Biologists: An Introduction to Linux, Bash Scripting, and R
Reach your personal and professional goals
Unlock access to hundreds of expert online courses and degrees from top universities and educators to gain accredited qualifications and professional CV-building certificates.
Join over 18 million learners to launch, switch or build upon your career, all at your own pace, across a wide range of topic areas.


