
Introduction to phylogenetics: tools and models

Within the first year of the coronavirus disease 2019 (COVID-19) pandemic, almost 400,000 whole or partial severe acute respiratory syndrome coronavirus 2 (SARS-CoV-2) genomes were generated and shared openly, marking an unprecedented worldwide response in pathogen genome sequencing.
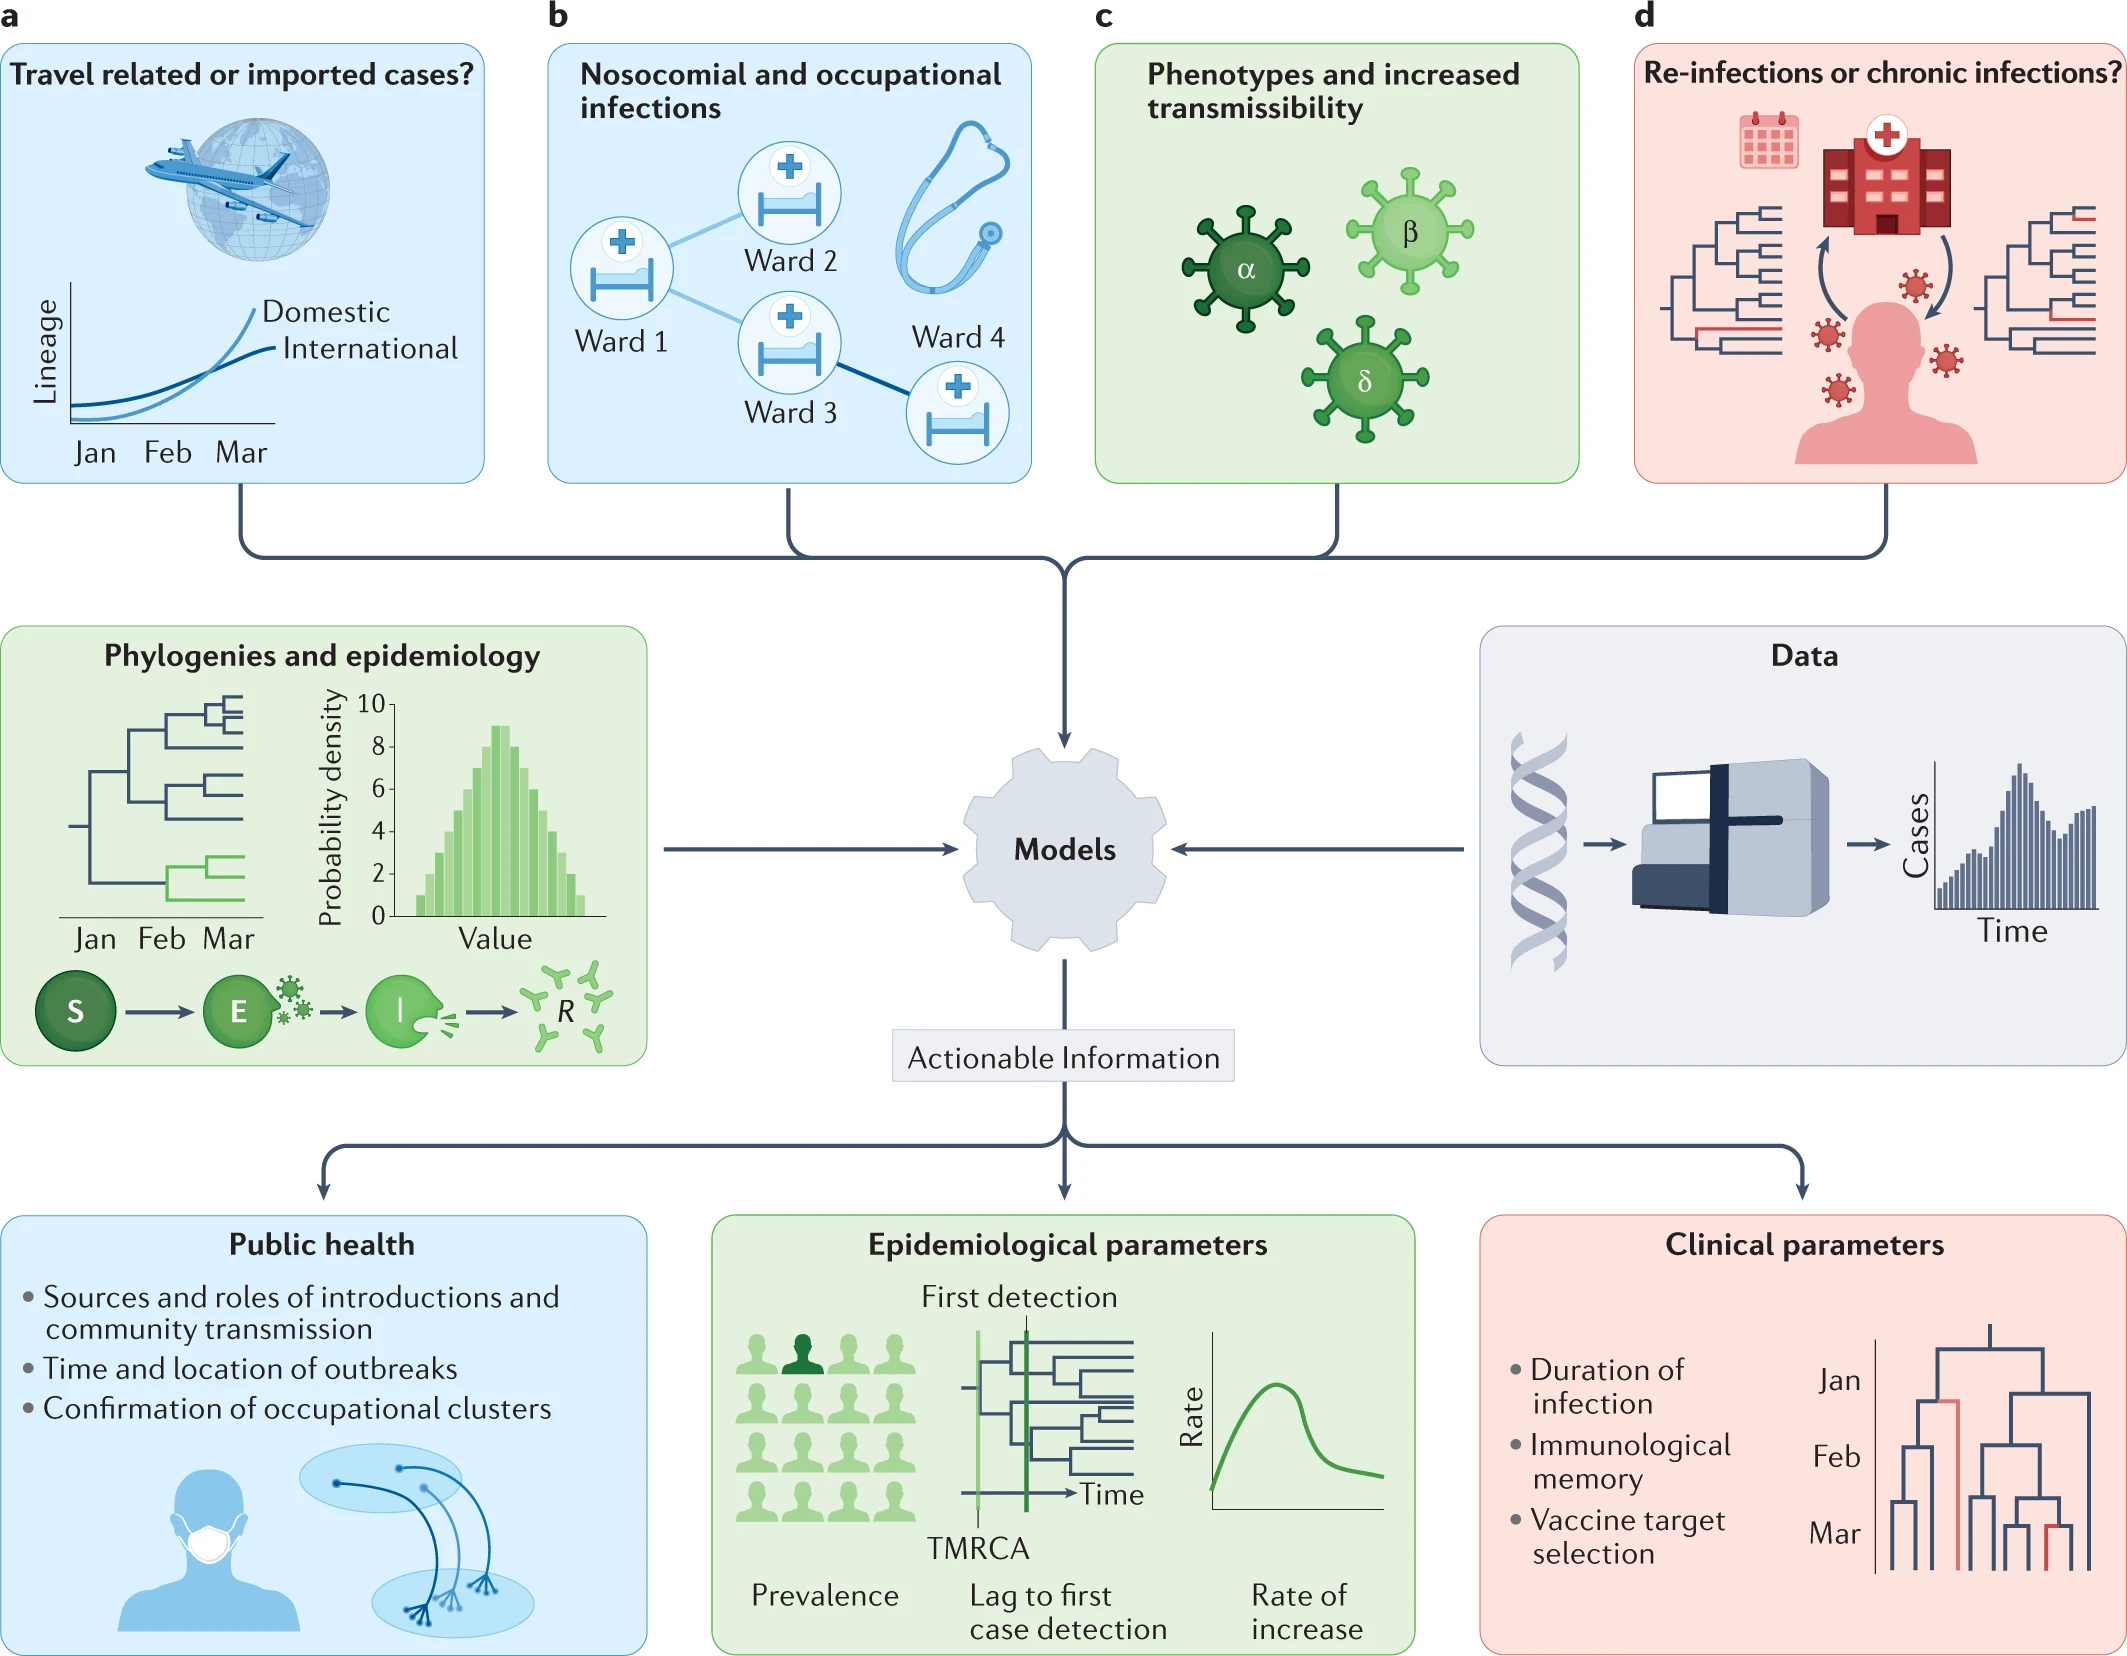
Phylogenetic tools have proven increasingly important in the public health management of a variety of viral epidemics, but the COVID-19 pandemic is the first global health emergency in which large-scale, real-time genomic sequencing and analysis have guided public health decisions. SARS-CoV-2 has been evolving at an estimated nucleotide substitution rate ranging between 10e−3 and 10e−4 substitutions per site and per year. The global epidemiological and virological situation changed constantly during the pandemic, and genomic sequence analysis was crucial in tracking the changing scenario (Figure 1).
Click here to enlarge the image
Figure 1- Phylodynamic approaches to the investigation of SARS-CoV-2 transmission. Source: Nature Reviews Genetics
Phylogenetic tools like Pangolin and Nextclade can unlock information from sampled genomes combined with epidemiological data like:
- Quantifying international virus spread
- Identifying outbreaks and transmission chains in specific settings
- Estimating growth rates and reproduction numbers
- Identifying and tracking mutations of interest
- Discovering and analysing variants of concern
- Investigating intra-host virus evolution
Different approaches to building the phylogenetic tree:
Parsimony approach – Maximum Parsimony is a character-based approach that infers a phylogenetic tree by minimising the total number of evolutionary steps required to explain a given set of data assigned on the leaves. Tools that use parsimony include IQTREE though it should be noted this is a tool to generate ML trees and USHER.
Maximum likelihood approach- Maximum Likelihood (ML) is a method for the inference of phylogeny. It evaluates a hypothesis about evolutionary history in terms of the probability that the proposed model and the hypothesised history would give rise to the observed data set. The supposition is that history with a higher probability of reaching the observed state is preferred to history with a lower probability. The method searches for the tree with the highest probability or likelihood. ML is implemented on FasTree, RAxML.
How to read a phylogenetic tree:
There are 2 parts to the phylogenetic tree. The nodes and the branches (Figure 2). The nodes on the tip of the tree represent the cases having some ancestry that existed as a putative virus in an individual. And the internal nodes between the branches make up the ancestor cases that are carrying the mutations from which further diversion was possible. The branches represent the transmission chains, which are a combination of numerous transmission events taking place and is represented by the branch length.

Click here to enlarge the image
Figure 2 – Different graphic representations of a phylogenetic tree.
Bootstrapping: Bootstrap values in a phylogenetic tree indicate that out of 100, how many times the same branch is observed when repeating the generation of a phylogenetic tree on a resampled set of data. If we get this observation 100 times out of 100, then this supports our result.
Making sense of genomic data: COVID-19 web-based bioinformatics


Making sense of genomic data: COVID-19 web-based bioinformatics
Reach your personal and professional goals
Unlock access to hundreds of expert online courses and degrees from top universities and educators to gain accredited qualifications and professional CV-building certificates.
Join over 18 million learners to launch, switch or build upon your career, all at your own pace, across a wide range of topic areas.


