Skip main navigation

New offer! Get 30% off your first 2 months of Unlimited Monthly. Start your subscription for just £29.99 £19.99. New subscribers only. T&Cs apply

Find out more

Networks in action: Mapping the Australian Twittersphere

Researchers at the Digital Media Research Centre, QUT, discuss how they use social media analytics to map relationships among Australian Twitter users
1
Jean Burgess: Mapping the Australian Twittersphere is a long-term project in the QUT Digital Media Research Centre, one which seeks to identify all Australian Twitter accounts.
9.7
Axel Bruns: We first examined all global Twitter accounts - roughly 870 million when we last did this. We filtered them by what they said about themselves in their profiles; what location and description they had set, and what timezone they were in. Not everyone fills this in, but for many accounts at least one of these markers is set.
27.4
Jean Burgess: Filtering for identifiably Australian cities, states, and timezones left us with some 2.8 million Australian Twitter accounts, more than 12% of the Australian population. We then retrieved the follower networks for these accounts, and filtered the network to only include users who had at least 1000 connections in the network. This resulted in 140,000 accounts, with 22.8 million connections amongst them. We mapped these relationships using Gephi, the same tool that you’ll be using in this course.
57.5
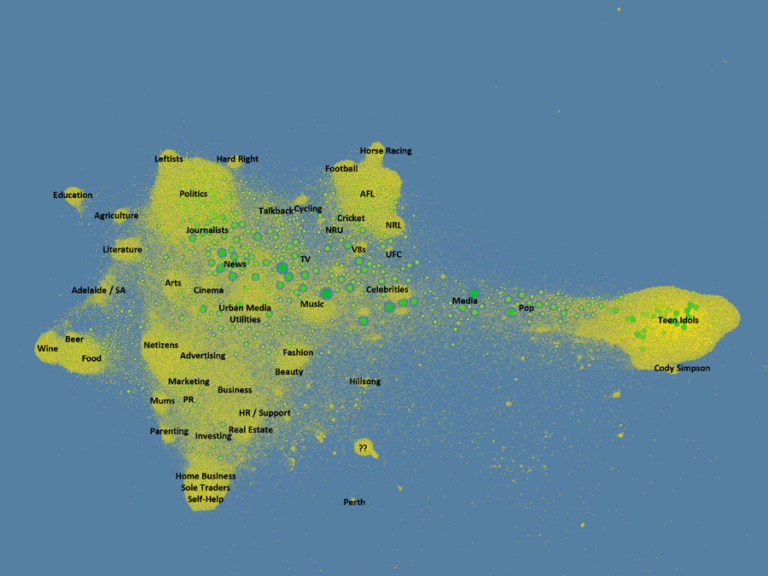
In the map, each dot represents a single account: the larger, greener dots are the accounts with the most followers in the network.
64.3
They’re placed on the map according to how they’re connected with each other: Groups of accounts with lots of connections amongst each other are placed close to one another, forming a dense cluster, and groups and clusters that do not have many connections in common are much further apart. This then allowed us to qualitatively analyse the network clusters, and for each cluster examine what the central accounts were. From this we could infer what themes and topics drive those clusters, from politics to entertainment and beyond.
91.1
Axel Bruns: For instance, there is a fairly large politics cluster, which is also positioned fairly closely to journalism and news. This isn’t too far away from the sports cluster, which further subdivides into the various sports that are popular in Australia, because fans of Australian Football aren’t necessarily also fans of motor racing, and so on. Further, there are various clusters related to business, lifestyle, the arts, and food culture, with the latter subdividing into good eating, wine, beer, and food tourism.
119.6
Jean Burgess: That’s why Adelaide, as a major destination for food tourism, is also close to this region of the network. That’s not to say that other accounts in the network aren’t also interested in good food,
130.2
but these are the accounts who take a full-time and often professional interest in these topics: they represent food growers, restauranteurs, craft brewers and wineries. Quite separate from this is the teen culture cluster on the right of the map. This represents a strong and very active community of accounts that follow and talk about major teen acts from One Direction to Five Seconds of Summer, and we think they’re there because their idols have specifically encouraged them to join them on Twitter.
156.8
Interestingly, this group of accounts arrived a few years later than the rest of the network: while much of the Australian Twittersphere formed in 2009 and 2010, most of these accounts only arrived from 2012 onwards.
170.4
Axel Bruns: This map is interesting in its own right as it tells us who and what is represented in the Australian Twittersphere, and what topics are absent. We can also see how different themes are related, how much overlap there is between politics and business, for instance, and how much less there is between politics and teen culture. This tells us something about broader groups in society, too.
190.2
Jean Burgess: But beyond merely mapping these follower networks, we also use this map as the basis for tracing user participation in current public debates and activities. When major news breaks, for instance, which parts of the network activate to talk about it? Does a political crisis only get take-up from the usual suspects in the politics cluster, or does the wider Australian user population also get involved? The answers to such questions provide us with new insights into the dynamics of such major events in Australian public life. There is ongoing work in updating the map. As we can see from the late arrival of the teen culture cluster, new accounts are added over time, and older ones may disappear.
229
These userbase dynamics can tell us a great deal about how Twitter is evolving as a platform for public conversations, and what role it plays in Australian society.

At Queensland University of Technology’s Digital Media Research Centre, we’re investigating large-scale networks. Take a tour with us above and find out how we’re mapping the relationships among Australian Twitter users and what this tells us about Australian culture and society.

While we work on large-scale research using social media data, the methods we use are similar to the ones you’re learning in this course. Fundamentally, you could work on similar projects and, with practice, produce analyses and visualisations of your own. By the end of this week, you’ll have new skills in visualisation to help you do so.

Graphic showing the network structure of Australian discussion topics of interest on Twitter, as discussed in the video and article on this page Map of the Australian Twittersphere © QUT (Click to expand)

Have your say

Have a closer look at the map of the Australian Twittersphere mentioned in the video and included above. Based on what you see, what conclusions can you draw from the map? Settle on an observation and then see how it compares with others in the discussion. Add your comment to a related post or add a new idea.

In the next step, we’re going to dive down into the theory of network structure and learn about the elements that give them shape.

This article is from the free online

Social Media Analytics: Using Data to Understand Public Conversations

Created by
FutureLearn - Learning For Life

Reach your personal and professional goals

Unlock access to hundreds of expert online courses and degrees from top universities and educators to gain accredited qualifications and professional CV-building certificates.

Join over 18 million learners to launch, switch or build upon your career, all at your own pace, across a wide range of topic areas.

Start Learning now