Skip main navigation

New offer! Get 30% off your first 2 months of Unlimited Monthly. Start your subscription for just £35.99 £24.99. New subscribers only T&Cs apply

Find out more

Learning a model from example data

Watch Marcel Lüthi explain how this central idea behind statistical shape models works.
6.8
Welcome back. We have now seen that we can model shape variation by modelling deformations using a Gaussian Process. In this video, we’ll show you how you can use example data to estimate the mean and the covariance function of such a Gaussian Process.
29.1
We have started with the reference shape gamma r.
35.8
We have seen how any shape gamma can be obtained by moving the points of this reference shape.
45.5
We notice that by construction, the target shape gamma will be described by the same number of points as the reference shape. Furthermore, we find, for each point of the reference shape, the corresponding point in the shape gamma. We say that the shapes are in correspondence or that u establishes correspondence between the two shapes.
73.9
If we have a set of shapes that are in correspondence, we can easily compare them and use them to compute statistics. Consider, for example, the point at the tip of the thumb. We can find that point in all the example shapes.
99.5
And we can observe its deformation in all the examples.
116.4
Now, what we can do is we can compute the average deformation at this point. We could even go further and we could estimate correlations from these examples. This can be done by taking a second point.
147
Similarly, we can take these deformation and estimate from them the correlations.
155.7
With these ideas, we can compute our first mean and covariance function for the Gaussian Process model. If we are given n deformations here, we can estimate from these deformations the mean and the covariance using the standard formulas for the sample mean and the sample covariance from basic statistics.
184.3
Let us summarise how we build a shape model. We first select a reference shape. We find deformations from the hand to the example data. This gives us correspondence.
201
We then estimate the mean and the covariance function. We define a Gaussian Process using the estimated parameters.
211.6
As the u here in this formula is a probabilistic quantity, so is the shape that it generates. So this gamma in this formula is actually a probabilistic description of a shape. Congratulations. Now, you know how to build a shape model. As a first result, we see here the average hand shape.
240.6
This simple procedure is everything that is needed to build the most important class of statistical shape model as they are currently used in research and industry.
254
The only important point that we have not discussed here is how we get these deformations that relates the reference shape to the example shapes. We will come back to this question towards the end of the course.

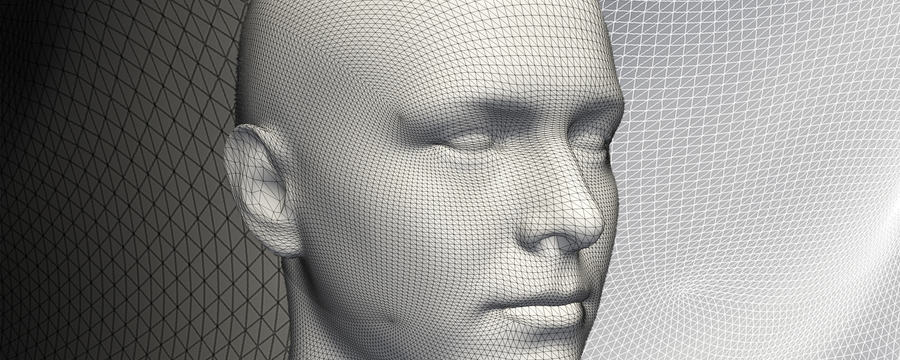
It is very difficult to explicitly model the shape variations that define a shape family. Fortunately, we can still obtain very powerful shape models, by learning the typical deformations that occur within a shape family from a set of normal example shapes.

In this video we will explain what it means for shapes to be in correspondence, and how this helps us to learn shape variations from data. At the end of this video you will be familiar with the most popular type of shape models currently used in science and industry.

This article is from the free online

Statistical Shape Modelling: Computing the Human Anatomy

Created by
FutureLearn - Learning For Life

Reach your personal and professional goals

Unlock access to hundreds of expert online courses and degrees from top universities and educators to gain accredited qualifications and professional CV-building certificates.

Join over 18 million learners to launch, switch or build upon your career, all at your own pace, across a wide range of topic areas.

Start Learning now