
Indicators for measuring health inequalities
We could look at many different indicators and see the same pattern of health inequalities and deprivation closely linked to the health outcome.
Premature mortality from heart disease and stroke
For example, here we see that premature mortality from heart disease and stroke was the highest in deprived areas in England and gradually declines, with the least premature mortality in the least deprived areas.
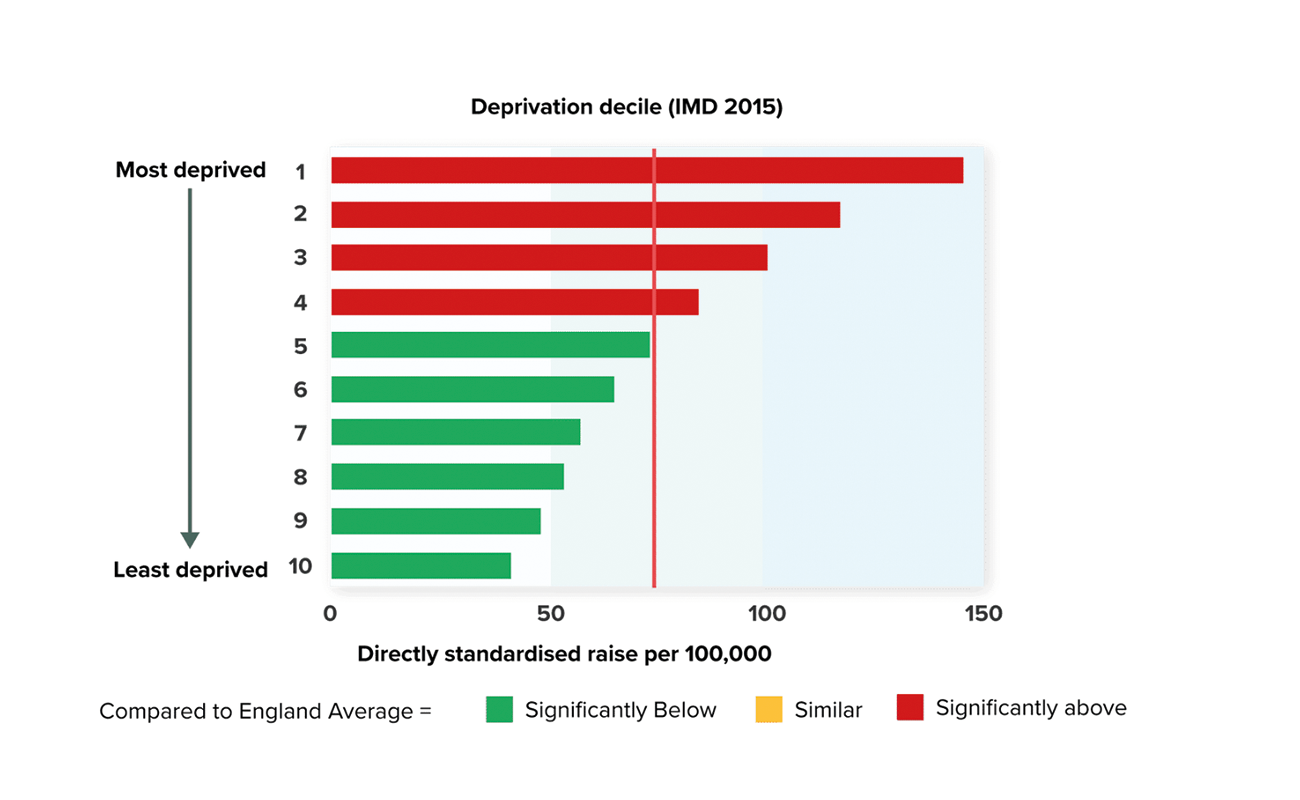 Data source: PHE, 2019
Infant mortality rate
Here we see that infant mortality in England is the highest in deprived areas and gradually declines with the least infant mortality in the least deprived areas.
 Data source: PHE, 2019
Babies born at a low birth weight
And here we see a higher percentage of babies born at term with low birth weight, again the highest in deprived areas and gradually declining with the fewest babies born at term with low birth weight in least deprived areas.
 Data source: PHE, 2019
So what we are seeing here is that in general the lower an individual’s socioeconomic position, the worse their health. This is a global phenomenon, seen in low, middle and high-income countries. But we need to pay attention to that gradual and progressive slope. This is a concept that we call the social gradient. This has been described as:
“the gradual and progressive improvement in health outcomes as the socioeconomic status or class position is raised, when comparing members of a society. It can also be represented as demonstrable progressive worsening of health outcomes in groups of progressively lower social status, income, social class, occupation or education.” (World Health Organization, 2017)
The social gradient in health means that health inequalities affect everyone. People who are less advantaged in terms of socioeconomic position have worse health (and shorter lives) than those who are more advantaged. But please note: this applies across the board. People in the middle of the socio-economic ladder also have worse health outcomes than the people above them on the socio-economic ladder. People at the top of the socio-economic ladder live longer lives and have better health outcomes that those just below them on the ladder, and there is a downward gradient until the bottom of the social ladder is reached. The people who are most disadvantaged in terms of socio-economic position have the worst health outcomes and shortest lives, and shortest healthy lives.
Tackling Public Health Issues: Concepts and Evidence


Tackling Public Health Issues: Concepts and Evidence
Reach your personal and professional goals
Unlock access to hundreds of expert online courses and degrees from top universities and educators to gain accredited qualifications and professional CV-building certificates.
Join over 18 million learners to launch, switch or build upon your career, all at your own pace, across a wide range of topic areas.


