
Crisis Management: Multi-Dimensional Typologies
For some, the categorical list of crisis type differentiation doesn’t meet their specific needs. Some researchers have determined that the complexity of business today makes it very difficult to create an exhaustive list of possible crisis types that would result in a manageable number of entries. They suggest that there would simply be too many different items on a categorical list to be useful. They also suggest that it would be more useful to think of crisis types in terms of their characteristics, not their category. The logic for this approach is summarized by researcher and author Stephan Gundel, in his article Towards a New Typology of Crises. He suggests:
“Classifying crises is ‘the first step to keep them under control’. A useful classification system allows for analysis and planning of crisis management actions. Four conditions must be met to produce a useful typology: 1) The classes used in a typology should be mutually exclusive; 2) The typology should be exhaustive, thus covering all possible crises both now and in the future; 3) The typology should be practically applicable, suggesting both measures of prevention and actions for resolution; and 4) the typology should be pragmatic, thus manageable.”
Using these criteria as a guide, you will now be introduced to three typologies that are presented as two-by-two or “four-area” matrices. Each will attempt to illustrate how four combinations of two different characteristics can be used to meet the objectives set forth above. As you read through the following, consider the effectiveness of this method of typology creation. You may find this method more common-sensical than the categorical list approach, or you may find these more limiting or difficult to use. Ultimately, all we are trying to create is a way for high stakes leaders at your organization to differentiate between different types of crises for planning prevention and management purposes.
As you move into an exploration of three examples of four-area matrix typologies, you are invited to learn a great deal more about this topic if you can access the work of Albena Bjorck and the article titled Crisis Typologies Revisited: An Interdisciplinary Approach. This research paper, published in 2019, was the inspiration for the presentation of the following examples. It can be found here.
Example 1: Predictability-Influence Matrix
The first typology presented here was created by Stephan Gundel. His four-area matrix was based on two variables: Predictability and Influence. He defined predictability as the extent to which a particular variety of crisis could be predicted based on an organization’s previous experiences. Examples of these predictable events are transport accidents, water shortages, technical risks, and social issues. The other dimension in Gundel’s matrix is Influence or Influenceability. This dimension considers known and executable actions that can be taken to address the causes of a crisis.
As a result of comparing two different conditions for each of these two dimensions, the resulting typology produces a matrix that looks like this:
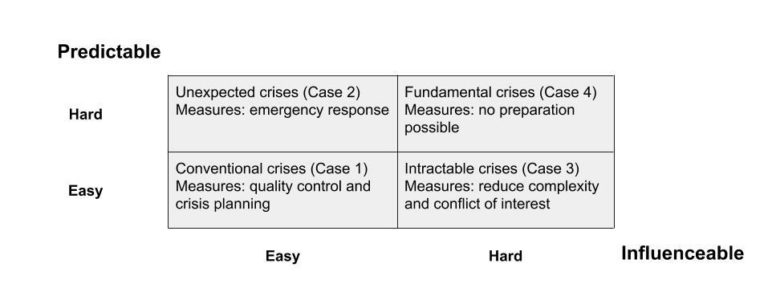
Gundel has labeled each of the four quadrants in this example as: 1) Conventional; 2) Unexpected; 3) Intractable; and 4) Fundamental. This approach allows a crisis manager to consider very specific crisis scenarios, the appropriate actions to take to prevent each scenario, and to plan a response for each, should any of the four varieties appear.
For Conventional crises, like mishaps in a production facility or a transportation sector accident, a crisis management team could easily predict the conditions within which a crisis could occur. Organizational leaders can also identify the steps necessary to influence the likelihood of an occurrence. Therefore, potential crises in this quadrant should be relatively easy to prevent with proper quality controls and planning.
Unexpected crises are manageable but difficult to predict. Winter and summer storms for airlines are very difficult to predict, but the procedures necessary to manage them are relatively easy to implement. You learned earlier about JetBlue’s Valentine’s Day operational crisis. Had JetBlue followed a more conventional bad weather contingency plan, the outcome would not have reached crisis level.
An Intractable crisis, according to Gundel, can be easily anticipated, but “interference is almost impossible due to the attributes of the systems concerned.” The example provided by the author of an Intractable crisis was the Chernobyl nuclear disaster. A current example of an Intractable crisis appears to be the COVID-19 pandemic.
Fundamental crises are both unpredictable and difficult to influence. These are clearly the most dangerous type and they are the most challenging to prevent or prepare for. The tragic events of 9/11/2001 in the United States is an example of this type of crisis.
Now that you have seen an example of a “four-area” matrix of crisis types, what do you think? Do you find this approach easier or more challenging to create and implement? As there is ultimately no best answer to the question of an optimum approach, you can feel free to use the approach that best suits your needs. Before moving on to two additional short, similar but different, four-area typologies, you may find this a good time to take some notes on your reactions to this approach.
Example 2: Probability-Impact-Matrix
The second typology presented here was created by Nassim Taleb and was explored in detail in the 2007 book The Black Swan: The Impact of the Highly Improbable. In Taleb’s four-area matrix, he used the two variables: 1) Probability of Occurrence; and 2) Payoff or Impact. According to Bjorck’s interpretation of Taleb’s work, here is why this four-quadrant matrix can be useful:
“In the context of the last financial crisis, risk assessment received a new interpretation and meaning through the work of Nassim Taleb. His analysis of risk events questioned the overreliance on statistics and addressed the illusion that complex models can predict the future. According to Taleb, the human mind suffers from three limitations when it comes to interpretation of past experiences: 1) ‘the illusion of understanding, how people think they know what is going on in a more complex and random world than they realize’, 2) ‘the retrospective distortion, or history seem clearer in a history book than in an empirical reality’ and 3) ‘the overvaluation of factual information, or the handicap of authoritative and learned people.’
People regularly dismiss improbable events as they seek arguments to justify their own prognoses than to falsify them. They prefer to concentrate on familiar information sources and a few known scenarios. When the unexpected and unthinkable happens, they try to rationalize ex-post. These unexpected and unthinkable events happen more often than we realize – Taleb calls them ‘black swans’.”
How does this background information help describe the matrix offered by Taleb? It provides context for how an organization might organize its efforts to prevent and then, if necessary, manage a crisis. The figure below illustrates this four-area matrix. On the vertical axis, Taleb suggests differentiating events by the extent of their impact. (Of note here, Taleb uses this same matrix to describe financial modeling, which is why ‘payoff’ is used along with ‘impact’. For our purposes, we are more interested in the impact perspective.) On the horizontal axis, Taleb uses probability of occurrence and differentiates between high and low.
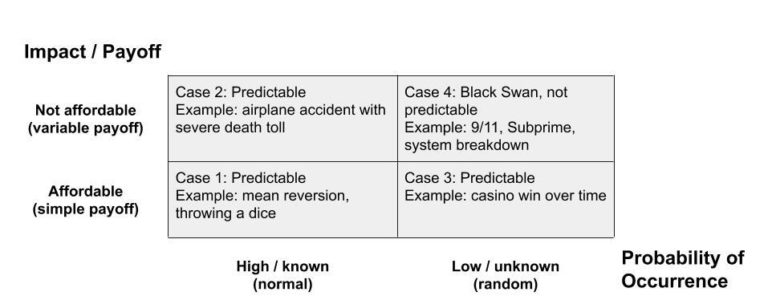
For Case 1, in the lower left-hand quadrant of the matrix, crises are highly probably, highly predictable, and relatively low stakes – low impact, as Taleb would describe them. Similar to the first matrix we reviewed, these cases should be relatively easy to prevent or manage, when they do appear.
For Case 2, in the upper left-hand quadrant of the matrix, events are less likely than in the lower left-hand quadrant, but they are able to be predicted through the use of mathematical models. In this quadrant, however, events are highly impactful when they do happen. This is the quadrant that supports the argument for investment in safety processes and procedures, despite the low probability of occurrence – the argument being: even one is not acceptable or affordable.
For Case 3, in the lower right-hand quadrant, the stakes are low and the likelihood of an occurrence is very difficult to predict. Crises in this area are managed through prepared reparation processes. Their unpredictability makes them very expensive to prevent, but their low cost makes them relatively easy to remediate. A good example here is Customer Bill of Rights compensation for extensively delayed flights. We know that there will be flight delays, on occasion, but they are very difficult to predict. In these cases, a formalized remediation plan is the simplest way to resolve them when they do occur.
Finally, for Case 4, in the upper right-hand quadrant, the stakes are very high and the events are unpredictable. This is Taleb’s so-called ‘fourth quadrant” and the location within which Black Swan events are captured. These are the most challenging to manage and an organization is not likely to have a pre-planned response for crises in this category. But organizations can make commitments to general crisis readiness, to give them the best possible chance of surviving these highly impactful events.
Example 3: Locus-Controllability Matrix and the Responsibility Continuum
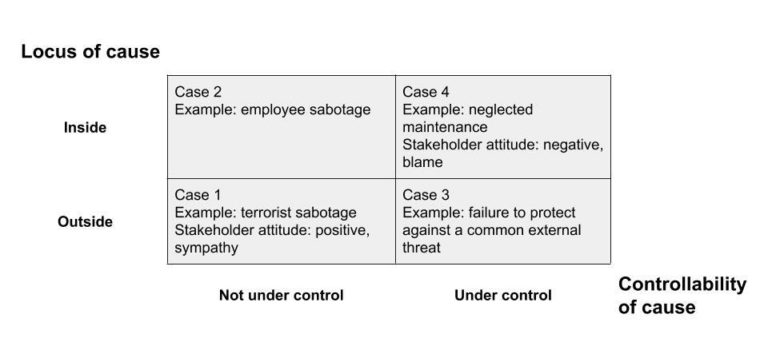
The third and final example presented here is based on how the organizational crisis response influences the perception of stakeholders. Weiner’s attribution theory (WAT), a topic discussed in greater detail elsewhere in this course, attempts to explain how people make sense of events. According to this theory, crisis events have an impact on stakeholder perceptions as they interpret the extent to which an organization should have been able to control the cause of the crisis. This interpretation provides the variable that is placed on the horizontal axis of the four-area matrix. The two alternatives for this variable are presented as under control (of the organization) and not under control (of the organization). The other variable is called locus of cause, which is a technical way of differentiating between events that were caused by actions occurring outside the company and those caused by internal actions.
This particular matrix may be a little more challenging to use for crisis prevention purposes than the others. It will, however, serve as an exceptional guide for the framing of stakeholder communications. The specifics of this value will be called out below.
For Case 1, in the lower left-hand quadrant of the matrix, crises are caused by a source outside of the organization and are not controllable. An example of this type of crisis is an act of terrorism. Crises in this quadrant are likely to be viewed by stakeholders quite sympathetically. Stakeholder communications in these cases should reflect the nature of the crisis and a sincere commitment to recovering from this “horrible stroke of bad luck”.
For Case 2, in the upper left-hand quadrant of the matrix, crises are not necessarily controllable by the organization, but there will be stakeholder attribution to some extent because the cause of the crisis originated inside the enterprise. In these situations, organizations must appreciate that stakeholders will want to know how the company “could allow this to happen.” Stakeholder communications should probably include information on the nature of the event and how, in fact, this was allowed to happen.
For Case 3, in the lower right-hand quadrant, crises are caused by a source outside of the organization, but one that should have been predictable and controllable by the enterprise. In these cases, stakeholders will want to know why preventive measures weren’t in place and why they should trust that something similar won’t happen again. Potential crises in this quadrant should inform pre-crisis planning efforts as stakeholders will rightfully expect these types of crises to be preventable.
Finally, for Case 4, in the upper right-hand quadrant, crises are caused by an internal source and stakeholder perception is that the situation should have been preventable. This is the most difficult for an organization to have to endure as stakeholder response will be negative and potentially extreme. As with crises that are described the previous quadrant, these crises should form a platform for pre-crisis prevention and management planning.
There you have three examples of multi-dimensional, “four-area”, matrix-based crisis typologies. How did these compare to the categorical list approach to crisis organization? Perhaps you found elements of both to be interesting and useful? Both methods can be effective, as researchers have claimed. The most important lesson here is that there are many ways to organize a collection of crisis types and the best one for you and your organization is the one that most effectively helps you develop plans for crisis prevention and, when necessary, crisis management.
High Stakes Leadership: Leading in Times of Crisis


High Stakes Leadership: Leading in Times of Crisis
Reach your personal and professional goals
Unlock access to hundreds of expert online courses and degrees from top universities and educators to gain accredited qualifications and professional CV-building certificates.
Join over 18 million learners to launch, switch or build upon your career, all at your own pace, across a wide range of topic areas.


