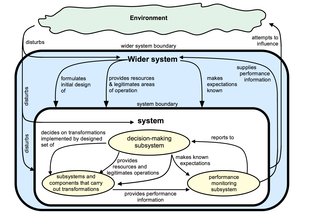
The Formal Systems Model suggests and supports the following analytic questions [1]: What is the continuous purpose or mission of the system? What is the system supposed to do? Who …
The diagram above, which you first saw in Week 1, shows a generalizable model of a robust system capable of purposeful activity without failure. It is called the Formal Systems …
At the end of Week 1 you have been introduced to some of the basic ideas of systems thinking and some of the techniques for drawing systems diagrams. These include: …
Our multiple cause diagram is given above. It shows the obvious causes for people waiting in the corridor, namely too many people being admitted to the hospital but there being …
Exercise Analysing failure with multiple cause diagrams Imagine that as the manager of a hospital you have the problem that patients are spending an unacceptable time on trolleys in a …
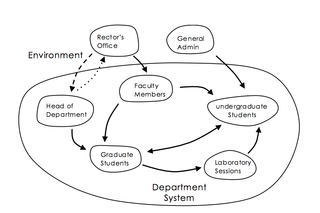
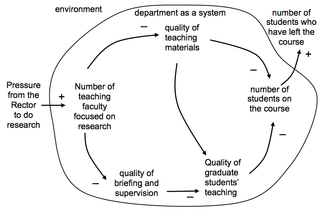
The previous step set the exercise of drawing a system map and influence diagram for a hospital system. Our diagrams are given below: In this system map the components inside …
Exercise Imagine you are the CEO of a hospital with an A&E (Accident & Emergency) department. For this exercise suppose you have the problem that newly admitted accident and emergency …
Hospitals and Sheltered Housing in the Bed-Blocking System Over the past few years, it has become common in the UK for elderly patients to remain in hospitals after their clinical …
System dynamics, developed by J. W. Forrester in the 1960s, goes far beyond diagrams to analyse the behaviour of complex systems using qualitative and quantitative methods to model the dynamics …
An influence diagram represents the main structural feature of a system and the important influences that exist between them. It presents an overview of areas of activity, organisation and other …
Multiple cause diagrams are used to explore why changes or events happen in systems. They do not predict behaviour, but may give insights into the multiple causes of system behaviour …
Sign diagrams are used to represent relationships between variables. The go beyond the qualitative towards the quantitative. They are useful for investigating the likely effects of changes and interventions in …
A system map shows the components and boundary of a system and the components of the environment at a point in time. A system map is effectively a list of …
The image above is an illustration of the Formal Systems Model. We will work towards defining this model in the rest of the steps this week. Building a Formal Systems …
There is another kind of feedback loop that can make systems spiral out of control. The example above shows one of increasing frustration for patients and increasing pressure on doctors. …