Skip main navigation

Get 30% off one whole year of Unlimited learning. Subscribe for just £249.99 £174.99. T&Cs apply

Communicating forecast information to users

This final lecture turns to one of the most important components of operational oceanography: communication. A forecast only becomes useful when it is understood, trusted, and actionable for the people …
Reading time series and vertical profiles

Maps show you where something is happening. But two other questions matter just as much: when is it changing, and what is happening below the surface? Time series answer the …

Reading forecast maps

Maps are the most common forecast products in operational oceanography. They let you identify spatial patterns – fronts, gradients, eddies, upwelling regions, and large-scale circulation features – at a glance. …

How to read forecast maps

The forecast map is one of the most important operational products of all – and this lecture shows you how to read one properly. You’ll see how spatial information is …

Key ocean variables in forecast products

Before you can read a forecast map or chart, you need to know what it is showing. In this lecture, we introduce the key ocean variables that appear in operational …

What the variables tell us

Before you can read a forecast map or chart, you need to know what it is actually showing. This reading introduces the core ocean variables commonly used in operational forecast …

From production to interpretation

This short reading will help you develop confidence in interpreting common forecast products used in operational oceanography. The emphasis is not on mathematics or programming, but on learning how to …

What Are Ocean Forecast Outputs?

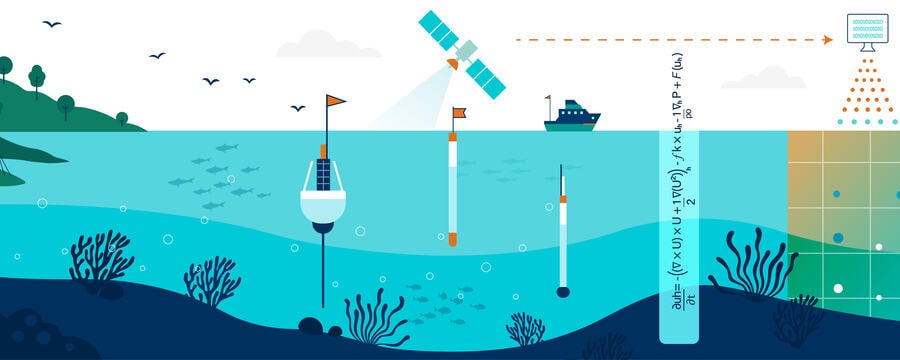
The first video introduces the concept of ocean forecast outputs and explains why forecast products are important in operational oceanography. Learners are guided through the pathway from observations and numerical …